Recently, in response to my post
Lending Club 2012 in Review, Part I: Loan Volume and Amount Funded, a commentator pointed out a few recent changes related to Credit Grade in Lending Club's November 2012 prospectus and scarcity of F credit grade loans. Also, on
LendAcademy forums, there were a few related discussions:
High demand for D-G grades,
Increase in Applicants With Public Record?, and
Has LC loan quality dropped?. So, I decided to review the prospectus to see if I can find these changes.
Below is a highlight from the
November 2012 prospectus available at Lending Club website:
Q: What are LendingClub loan grades?
A: For borrower members who qualify, we assign one of 35 loan grades, from A1 through G5, to each loan request, based on the borrower member’s:
- FICO score;
- our proprietary scoring model which takes into account many of the attributes previously used by us and also allows borrowers to have delinquencies and public records;
- loan term and loan amount
In addition to replacing previously listed loan and borrower attributes with the proprietary scoring model, the current prospectus also mentions
allowing borrowers with delinquencies and public records. Both terms are highlighted above in bold.
The fewer low quality D-G grade loans may be result of the proprietary scoring model modifying weight of previously used loan and borrower attributes or incorporation of new 'unknown' attributes.
Allowing borrowers with delinquencies and public records may be resulting in increase in borrowers with public record.
Such changes are not surprising as Lending Club is gearing up for IPO. It's focus has been shifting to non-lending financial institutions as lenders and attracting more borrowers to its platform becoming higher priority.
Can we confirm these changes using historical data from 2012?
Credit Grade Distribution of Monthly Loan Volume
The chart below shows the monthly loan volume in 2012 in relation to Credit Grade. The monthly volume lines for most months follow the same pattern except for December (Green line). There is a shift in the line for December from regular pattern for other months indicating there may have been a change in December how loans were allocated to different Credit Grade buckets.
 |
| Lending Club Monthly Loan Volume and Credit Grade in 2012 |
For most businesses, December tend to be a unique month due to holidays and end of calendar year. The chart below shows the monthly loan volume for 2011. The hypothesis being that if December is somehow unique month for share of loan volume across Credit Grade, it should show up in previous years too. As the chart shows, there is no deviation in line for December compared to the pattern for other months in 2011. This confirms that something changed in how credit grades are assigned for loans issued in December 2012.
 |
| Lending Club Monthly Loan Volume and Credit Grade in 2011 |
Monthly Loan Volume Change
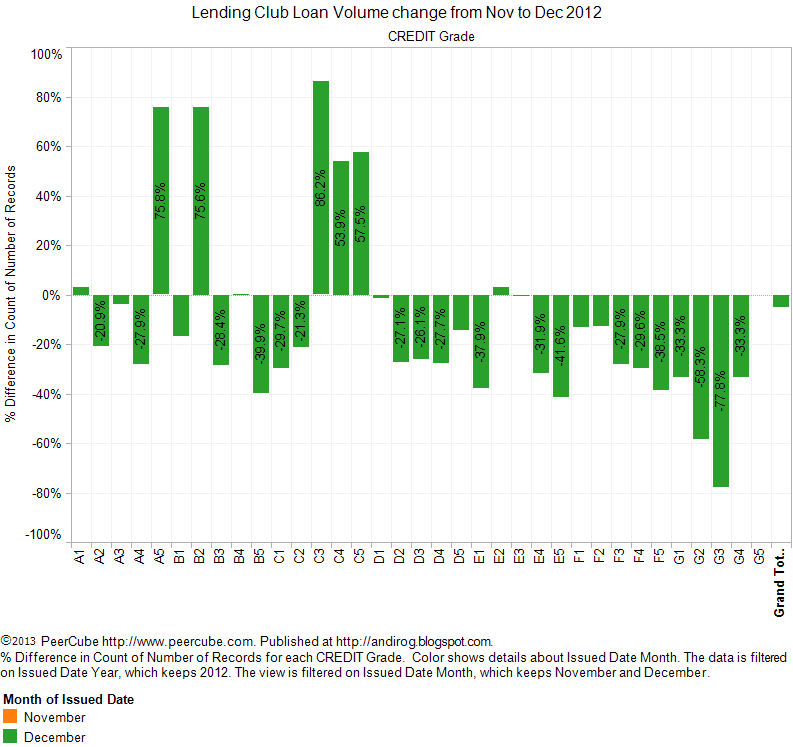
The chart below shows the percentage change in loan volume for each credit grade in December from previous month in 2012. The large spreads in percentage change for credit grades that normally has low loan volume is understandable. The interesting observation is that the percentage volume change for credit grade D through G is consistently negative in the month of December, indicating the loan volume for credit D through G was much smaller in December than previous month.
 |
| Lending Club Loans - Percentage Monthly Volume Change in December 2012 |
As a comparison, the chart below shows the percentage change in loan volume in November from previous month in 2012. The loans with credit grade D through G show large percentage increase in volume from previous month. Was the volume drop in December for loans with credit grade D through G due to increase in volume of same grade loans in previous month? At this point, it is difficult to separate the influence of policy changes from the up volume in previous month.
 |
| Percentage Monthly Loan Volume Change in Nov 2012 |
Another interesting observation is the large spreads in loan volume for loans with A through C credit grades in December. As shown in the chart for November, most volume changes for such loans will be typically low due to the high volume of loans. An usually large spread in volume will indicate influence of a policy change where shifting of loans taking place across credit grades from credit grade with decline in volume to credit grades with rise in volume.
Key Takeaways
- The "proprietary scoring model" appears to have made some adjustments that is shifting the loans across credit grade, most probably toward B and C credit grades.
- Without knowing the actual changes taking place in credit grade assessment of a loan, the credit grade will become an unreliable indicator of quality of loans. In my estimate, just considering Credit Grade as loan selection criteria was accounting for the quarter of the default risk.
- With the credit grade becoming "proprietary" measure, most lenders may benefit by using Interest Rate bins (buckets) instead. Any analysis of historical data based on credit grade will become less valuable due to uncertain changes in credit grade over time.
PeerCube: Benefits of Loan Details on One Page
In my last blog post
Lending Club 2012 in Review. Part III: Loan Title, Loan Description and State of Residence, I mentioned that I may take a short break to discuss a few development at PeerCube. In response, I received a suggestion to maintain the continuity of historical data analysis and discuss any
PeerCube updates in a small separate section of the blog post. I thought the idea was excellent and time to time I plan to include PeerCube updates at the end of regular blog posts.
The loan details page on
PeerCube includes 71 different loan and borrower attributes on one page. This collection of information enables users to quickly scan loan details to identify any unusual attributes. With the recent changes in Lending Club policies, it is becoming much more important to review the loan details.
 |
| PeerCube Loan Details page: Borrower Details |
The above screen capture of Loan Details page for a loan shows an example of discrepency that can be caught by reviewing this page. The Home Ownership is self-reported by the borrower. In this case, borrower reports Renting. Total Mortgage Accounts is reported by the borrower's credit report. In this case, credit report mentions borrower has three mortgage accounts.
Depending on your risk profile, you may decide to skip lending to this borrower due to financial uncertainty of the borrower. For example, this borrower may be a divorcee on hook for mortgage payments on a house occupied by ex-spouse, alimony, child support, etc. Such uncertainty about borrower's financial situation raises the risk profile of this loan significantly. Unless a lender was reviewing multiple spreadsheets made available by Lending Club or easy-to-scan one pager for the loan on PeerCube, he or she will misjudge the default risk with this loan.
Cash back rewards on
online gift cards


I feel that LendingClub has grown wise to the fact that many D-G grade loans are actually quite trustworthy if one examines the historical data. In this way, developing filters that focus on variables they don't control (DQs, Public records, Credit lines, etc) will maintain validity over time, but I think we will discover less and less of these high quality high interest loans as the LendingClub proprietary model learns to move them into B and C loan grades.
ReplyDeleteI am not sure how you define "trustworthiness" of D-G grade loans.
DeleteBased on PeerCube historical performance, for mature loans issued between 2007 and 2009, D-G grade loans have default rate of 20.51% and ROI of 6.53% compared to default rate of 13.44% and ROI of 6.74% for all grade loans issued in the same period.
Anil, can you post the model they had before it became proprietary? It would be good to look at considering it will be a clue as to what they still use today.
ReplyDeleteSimon, the old model is listed in old prospectus. Here is the link for July 2012 prospectus. https://www.lendingclub.com/info/prev-prospectus.action. Other prospectus can be obtained from SEC site.
DeleteJust finished reading it, that's really helpful. Thanks Anil.
Delete"D-G grade loans have default rate of 20.51% and ROI of 6.53%"
ReplyDeleteI assume that you meant ROI of 20.51% and default rate of 6.53%?
"With the credit grade becoming "proprietary" measure, most lenders may benefit by using Interest Rate bins (buckets) instead. Any analysis of historical data based on credit grade will become less valuable due to uncertain changes in credit grade over time."
Isn't there still a one-to-one relationship between loan grad and interest rate given by:
https://www.lendingclub.com/public/how-we-set-interest-rates.action ?
Nope, I meant ROI of 6.53% and default of 20.51%. :-) This ROI and default rate is based on matured loans only issued between 2006 and 2009.
DeleteNumber of loans defaulted = 263
Number of loans fully paid = 1,021
Default Rate = 263 / (263 + 1,021) = 20.48%
ROI from defaulted loans = -47.48%
ROI from fully paid loans = 20.49%
ROI from matured loans = 6.57%
Yes, there is one to one relationship with credit grade and interest rate, at a single point in time. Over time, credit grade relationship with loan and borrower attributes can change depending on how credit grade was estimated. But the relationship of interest rate with loan and borrower attribute doesn't change with interest rate.
I am sorry, but I am a bit confused....
DeleteHow would you calculate the total ROI for all loans based on the numbers above?
Also, why is the ROI higher for the fully paid loans than from the matured loans (I assume that fully paid loans were paid before the 36 months were up)?
Are you saying that a particular loan grade, for example D5, has not always had a rate = 19.72%? I thought that the grade may change with scoring model, but then the interest rate would also change accordingly?
The ROI calculations are described on PeerCube at http://peercube.com/lc/faq.
DeleteThere are only two final status for all loans - Fully Paid (Loans that were paid in full by maturity date or earlier) and Default (Loans that were either charged-off or defaulted without making the fully payment on loan). The ROI is listed for fully paid loans and defaulted loans. I am not comparing fully paid loans with matured loans. Sorry, I am having trouble understanding where is your confusion? You may need to elaborate.
Lending Club decides and revises interest rate for a particular credit grade once or twice a year.
Loan Grade is an arbitrary attribute estimated by Lending Club. When Lending Club changes the underlying method for estimating Loan Grade, it breaks the existing relationship of Loan Grade with other loan attributes. Though Interest Rate is decided by Lending Club for a grade, Lending Club can't change the relationship of interest rate with other loan attributes.