Pages

Showing posts with label PeerCube. Show all posts

Monday, March 06, 2023

Blog Reboot (maybe) and What’s Next

It has been almost a decade since I updated this blog. Perusing the previous blog posts, it is interesting to see evolution of my professional interests from Data storage and Clouds to FinTech and Startups. This blog appeared to had become an exploration of random ideas and interests while I was in between larger projects.

Start and End of PeerCube

My previous interest in crowdfunding and analyzing peer to peer lending data evolved into PeerCube, a startup helping retail lenders, and a few institutional lenders, make better lending decisions. While writing was on the wall for a while, once Lending Club decided to discontinue retail lending platform, there was no path forward for PeerCube to continue. As a bootstrapped startup focused on retail lenders and being very efficient with our limited resources, we also couldn't figure out a pivot to continue operations. Considering over the years, we were pitched several competitors for potential acquisition, we feel PeerCube did quite well. But, it was time for us to start next chapter in our lives.

Podcast 19: Anil Gupta of PeerCube on P2P Lending Analysis

During the existence of PeerCube, we captured and collected lot of lending data, specifically from Lending Club's primary and secondary platforms that we felt was relevant for broader consumer lending industry. There were also some good posts shared on PeerCube blog based on analysis of lending data, for example changes in FICO score during the life of loans and how it impacted the final outcome of the loans. Unfortunately, they all have lost any relevance now and are no longer available online.

What's Next

During the past few years, I have explored and learnt about several random areas, such as Autonomous driving, Satellite imaging, Text mining, Options trading, Web development, in addition to moving to Japan due to family reasons and learning Japanese. I continue to be interested in AI/ML/DS applications and data-intensive projects.

While I am not planning to restart this blog again, going forward I will use it as personal repository of my notes, most likely in unfinished, incomplete, and unpolished state.

Monday, March 04, 2013

Lending Club Loans - Principal Paid Back and Months of Payment

In the last post, I analyzed the defaults based on number of monthly payments made by borrower before default. In next post, I will analyze the defaults using another methodology of principal paid back before default. In this post, I will review the relationship between principal paid back and months of payment.

Principal Paid Back

While months of payments methodology provides us a time frame when most defaults occur, it doesn't provide a decent comparison for loans in different maturity cycle and loans of different maturity length. My expectation is that the principal paid back will serve as an appropriate proxy for matching the loans at the same point in maturity cycle. For example, a 3 year loan at 10% interest rate would take about 20 months (55% of maturity length) to pay off 50% of principal while same loan with 5 year term would take about 34 months (56% of maturity length) to pay off 50% of principal. In this analysis, I assume that defaults for these two loans should behave similarly when each has paid off same percentage of principal.

Principal Paid Back is one of my favorite data point in evaluating a lending strategy as it is a good method to gage the risk tolerance of a lender. It quickly communicates on average what percentage of principal is going to be recovered from defaulted loans. Combined with the return from fully paid loans, it also communicates how many loans a lender needs to recover principal lost from defaulted loans and just break-even.


For example, the screen capture above from PeerCube shows historical performance of loans issued between 2007 and 2009 for a specific lending strategy that only includes borrowers who own their home. On average, each defaulted loan paid back only about 42% of principal. To break-even, this strategy need to recover 58% of lost principal from other loans in the portfolio. With, on average, only 14% return (ROI to be discussed in future blog post) from fully paid loans, a lender need at least 4 loans to be fully paid to just break-even. If a lender invested in all loans meeting this criteria between 2007 and 2009, 55% of loans contributed 0% to return and only 45% loans contributed to achieving 7.32% ROI from this strategy.

Months of Payment

The chart below shows the Principal Paid Back as a function of Months of Payment for both 36 and 60 month loans. Actually axis are swapped as certain observations listed below are easier to see this way. [Edits 03/16/2013: As requested by Andrew in comments below, updated the chart to include linear trend lines and screen capture of trend model description.]


The 36 month loans and 60 month loans clearly have two different paths on  the chart. It is clear that the principal payback schedule is different for 36 month and 60 month loans. The scatter plot for 60 month loans shows most data points in the region below 30 months of payment and left of 50% principal paid back. This is primarily due to 60 month loans issued only since second quarter of 2010. The solid color at 100% principal paid back mark for loans with both terms is due to loans that are fully paid either on schedule or ahead of schedule.

The chart below shows the Principal Paid Back as a function of Months of Payment for loans with various credit grade.


This chart is very similar to the previous chart. From density of different colors, it can be observed that the 60 month loans are primarily carry credit grade E, F, and G. Also, it appears that majority of 60 month loans that are paid off early carried credit grade A, B, and C.

Key Takeaways

  • The Principal Paid Back would be a good data point to gage the risk tolerance of a lender and variance in return of a lending strategy over the loan maturity cycle.
  • Reviewing the loans that have paid back less than 50% of principal may offer better comparison between 36 and 60 month loans.

Monday, February 25, 2013

Lending Club Loans - Defaults with Loan Age, Part I

February has been slow month from blogging perspective for me. I spent majority of time making improvements to PeerCube. Three major enhancements released this month are ability to invest in multiple loans together from the list of loans, more robust BLE Risk Index that now includes 19 different loan and borrower attributes, and showing a list of loans with similar risk profiles as the one being viewed by a user.

When Default of Loans Start to Peak?

Recently, a participant on LendAcademy forum asked when defaults of loans start to peak. It is an interesting question so I decided to look further into historical data for Lending Club loans and see if I can find patterns for loan defaults. Unfortunately, Lending Club only provides point-in-time snapshot of historical loan data so I can't observe when a loan entered in default state. But, there are several different methods that can help provide insights from point-in-time snapshot.

One such method is to review the loans that are currently in default and when they were issued. This method assumes that similar pattern, in aggregate, will persist for loans in the future. One challenge with this method is that any variation in loan volume will skew the pattern. For example, if 1,000 loans defaulted out of 100,000 loans issued last year versus 400 loans out of 10,000 loans issued prior year, we may erroneously assume that loans default more within a year of being issued. In following analysis, I use the percentage of loans with default status to smooth out any effect of volume.

The chart below shows the percentage of loans with default status as a function of loan issued date. I only included 3 year term loans primarily because I have the historical data that covers the loans from issued date to maturity. Also, the 5 year term loans may have different default pattern. A peculiarity you may notice is the way I have chosen to plot X-axis (loan issued date). Instead of ascending issued year, I have reversed the axis and plotted percentage loan defaults with descending issued year. In fact, the chart below is a mirror image. As we are more interested in knowing when a loan may default, I believe flipping the X-axis better communicates visually the trend.


While reviewing this chart, think of that you are trying to find out how many 3 year term loans issued in January 2013 may default by the end of 2016. Think of right side of 2012 being end of 2013, right side of 2011 being end of 2014 and so on. The major assumption here is that future monthly default trend is exactly represented by the past monthly default trend.

Observations

While reviewing the above chart, two observations right away stand out:
  1. No loans are charged off or defaulted within first six months. This is understandable as majority of loans will go through stages of In Grace Period, Late (16 - 30 days), and Late (31 - 120 days) before being charged off. So, earliest most loans can be charged off is at least 120 days (4 months) after being issued.
  2. Th peaks appear during the year at regular interval. I am not very sure but I suspect this may have to do either with the time (end of December) when this historical loan file was downloaded or the Lending Club defaulting loans in batches at regular interval.
Based on the trend line models in this chart, for all 3 year term loans purchased in January 2013, we can expect 2.3% loans in default by the end of first year, 6.2% loans in default by the end of second year and 10.5% loans in default by the end of third year. By the time all loans mature, we can expect 12.4% loans originally issued to default. These numbers were obtained by substituting 0 for Month of Issued Date in trend line model for each year.

For 100 loans issued in January 2013, 2.3 loans can be expected to default in first year, 3.9 loans default in second year, 4.3 loans default in third year, and another 1.9 loan default after third year.

Key Takeaway

We may conclude from this analysis that the most default happen during the third year of 3 year term loans. But we need to be cognizant of the fact that the loans defaulting late in their maturity cycle have much lower impact on return as such loans have already paid back greater share of original principal.

In next post, I will further look in to default patterns of loans and also investigate other methods to analyze historical data for default patterns.


Friday, February 01, 2013

Lending Club Loan Volume and Borrower's Revolving Credit Line Utilization

In next few posts, I will review the loan characteristics and default rate with respect to the revolving credit line utilization of borrowers. I believe revolving credit line utilization is one of the major borrower attribute that influences the chances for borrowers to default.

Loan Volume

The chart below shows the Loan Volume (right Y-axis) and Cumulative Loan Volume % (left Y-axis) as a function of borrower's revolving credit line utilization. Almost 20% of loans are issued to borrowers who have revolving credit utilization less than 29% and 20% of loans are issued to borrowers who have revolving credit utilization greater than 80%. The loan volume rises with rising revolving credit utilization up to about 70% revolving credit utilization. A few loans have also been issued to borrowers whose revolving credit utilization was greater than 100%.

Lending Club Loan Volume and Borrower's Revolving Credit Line Utilization
The chart below shows the Cumulative Loan Volume % by loan issued year as a function of borrower's revolving credit line utilization. Do you notice a wide gap between the lines for loans issued in 2012 from the lines for loans issued in prior years? This gap indicates that borrower profile based on revolving credit line utilization for loans issued in 2012 is very different from prior years. In 2011, 18% of loans were issued to borrowers who used up to 20% of their revolving credit. The share of loan volume to such borrowers dropped almost half to 9% in 2012. Similarly, about 30% of loans in 2011 were issued to borrowers who used up 70% or higher of available revolving credit. The share of loans volume to such borrowers rose about 20% to 36%.

Lending Club Loan Volume by Issued Year and Borrower's Revolving Credit Line Utilization
These trends may indicate that quality borrowers with low revolving credit utilization are not much interested in borrowing through peer to peer lending platform. Also, peer to peer lending platform being attractive to borrowers with higher revolving credit utilization may have resulted in Lending Club relaxing the minimum credit criteria late last year.

Key Takeaway

  • If defaults and returns are closely related with borrower's revolving credit line utilization, I expect the loans issued in 2012 to behave very differently than the loans issued in prior years.

Expanded Credit Utilization Information on PeerCube

The Loan Details page on PeerCube contains additional information related to revolving credit line utilization that provides better context to lenders about borrower. For example, the screen capture below shows such information for a currently available loan that carries F2 credit grade. I typically gravitate toward reviewing information highlighted below. This borrower is carrying, on average, about $10,000 balance on each of his revolving accounts. All of his bankcards are maxed out and total credit balance exceeds $100,000.

Loan Details page on PeerCube with expanded credit utilization information.

Monday, January 21, 2013

Recent Changes in Minimum Credit Criteria by Lending Club

Minimum Credit Criteria

In November, Lending Club not only hide the details of underwriting process, as described in my previous post Lending Club Loans - Impact of Recent Changes, but also changed the minimum credit criteria for the borrowers. The new minimum credit criteria is much more lenient and directed at attracting lower quality borrowers.

The minimum credit criteria in the latest prospectus filed in November 2012 is listed as follows:
Under the current credit policy, prospective borrower members must have among other elements:
  • a minimum FICO score of 660 (as reported by a consumer reporting agency);
  • a debt-to-income ratio (excluding mortgage) below 35%;
  • minimum credit history of 36 months;
  • 6 or less inquiries in the last 6 months; and
  • at least 2 revolving trade accounts.
The minimum credit criteria in the previous prospectus filed in August 2012 is listed as follows:
Under the current credit policy, prospective borrower members must have among other elements:
  • a minimum FICO score of 660 (as reported by a consumer reporting agency);
  • a debt-to-income ratio (excluding mortgage) below 35%;
  • a credit report (as reported by a consumer reporting agency) without any current delinquencies, recent bankruptcy, tax liens or non-medical related collections opened within the last 12 months, and reflecting:
  • at least two accounts currently open;
  • for credit credits 740 and higher, no more than 8 credit inquiries on the credit report in the past six months and for credit scores below 740, no more than 3 inquiries on the credit report in the past six months;
  • a revolving credit balance of less than $150,000;
  • utilization of credit limit not exceeding 98%; and
  • a minimum credit history of 36 months.
The bold text above indicates the new condition added in the minimum credit criteria and the strikeout text above indicates the conditions removed. The new condition is nothing more than the lenient version of number of credit inquiries in the past six months.

Public Records

There was some discussion on LendAcademy forum about Increase in Applicants With Public Records. The table below shows the monthly loan volume with respect to number of public records for loans issued in 2012. In November, 127 loans were issued to borrowers who had at least one public record. The number of such loans increased to 202 in December, an increase of almost 60% over previous month.


I believe the changes in the minimum credit criteria as mentioned in November prospectus may have resulted in increase of borrowers with public records in December. No longer Lending Club excludes borrowers with current delinquencies, recent bankruptcies, tax liens, and non-medical related collections in past 12 months.

Did Lending Club modify 'proprietary' credit grade model to accommodate this change in minimum credit criteria? I was expecting the credit grade shifting to the right toward grade G for such loans. The table below shows the monthly volume and credit grade of loans issued to borrowers with more than 2 public records. There is no shift in credit grade of loans to borrowers with public records. It doesn't appear that Lending Club credit grade model accounts for the number and type of public records.


Accounts Now Delinquent

The table below shows the monthly loan volume  with respect to borrowers' number of accounts currently delinquent. It is clear from the table that prior to December, Lending Club didn't issue any loans to borrowers who had delinquent accounts at the time of applying for loan. In December 2012, Lending Club issued 15 loans to borrowers who had one or two accounts delinquent at the time of loan application.


The credit grade for loans to borrowers with one account delinquent ranged from A5 to F1 while the one loan to borrower with two accounts delinquent has credit grade of F3. It is too early to determine whether Lending Club's proprietary credit grade model accounts for borrowers who have accounts delinquent currently.

Amount Delinquent

The table below shows the monthly loan volume with respect to total amount currently delinquent for borrowers. Similar to accounts now delinquent above, in December 2012, Lending Club started issuing loans to borrowers who have any amount delinquent currently. In December 2012, Lending Club issued 10 loans to borrowers who had between $25 and $65,000 amount delinquent.


Did Lending Club proprietary credit grade model account for borrowers who have any amount delinquent currently? Not a chance! Any reasonable proprietary model most likely will consider borrower with higher delinquent amount to be of higher credit risk.

See the table below that shows the credit grade of loans issued in December 2012 to borrowers who had any delinquent amount. First, there is no visible pattern between credit grade and delinquent amount. Second, which reasonable model that accounts for currently delinquent amount will assign credit grade A5 to a loan for a borrower who has $65,000 in delinquent amount versus grade F1 to a loan for a borrower who has $25 in delinquent amount? This leads me to believe that the credit grade model doesn't account for amount currently delinquent.


Key Takeaways

  • Lending Club has relaxed the minimum credit criteria to attract more borrowers that most likely will result in more borrowers with higher credit risk on lending club platform.
  • Lending Club proprietary credit grade model doesn't appear to account for the credit quality of the new borrowers that only became eligible since lowering of minimum credit criteria.
  • Lenders may benefit by taking the 'common sense' approach to details of public record, and accounts and amount currently delinquent until sufficient historical data is captured to show the pattern and impact of such borrower attributes.

How can PeerCube help?

The loan details page on PeerCube can be of great help to lenders as it shows 71 different loan and borrower attributes including the above-mentioned attributes that may shed better light on borrower's credit quality.

Below is a screen capture of PeerCube's loan detail page for a C2 credit grade loan with such attributes highlighted. Will you invest in a C2 grade loan whose borrower has one bankruptcy, two tax liens, two delinquent accountss and $5,369 amount currently delinquent?


Reviewing the loan detail page, PeerCube users can avoid loans that may be of higher risk than the assigned credit grade represents.

Around the Web

In last few weeks, I have become a big fan of blog Long-Term Returns. I highly recommend the blog to all readers interested in personal finance and investment. Most personal finance bloggers tend to express opinions based on personal experiences and without supporting data. That is where this blogger sets himself apart with the analytical perspective. Though the blogger is not a fan of peer to peer lending, p2p lenders will also benefit from his coverage of related topics of bonds, treasuries and fixed income securities.

Monday, January 14, 2013

Lending Club Loans - Impact of Recent Changes

Recently, in response to my post Lending Club 2012 in Review, Part I: Loan Volume and Amount Funded, a commentator pointed out a few recent changes related to Credit Grade in Lending Club's November 2012 prospectus and scarcity of F credit grade loans. Also, on LendAcademy forums, there were a few related discussions: High demand for D-G grades, Increase in Applicants With Public Record?, and Has LC loan quality dropped?. So, I decided to review the prospectus to see if I can find these changes.

Below is a highlight from the November 2012 prospectus available at Lending Club website:
Q: What are LendingClub loan grades?

A: For borrower members who qualify, we assign one of 35 loan grades, from A1 through G5, to each loan request, based on the borrower member’s:
  • FICO score; 
  • our proprietary scoring model which takes into account many of the attributes previously used by us and also allows borrowers to have delinquencies and public records
  • loan term and loan amount
In addition to replacing previously listed loan and borrower attributes with the proprietary scoring model, the current prospectus also mentions allowing borrowers with delinquencies and public records. Both terms are highlighted above in bold.

The fewer low quality D-G grade loans may be result of the proprietary scoring model modifying weight of previously used loan and borrower attributes or incorporation of new 'unknown' attributes. Allowing borrowers with delinquencies and public records may be resulting in increase in borrowers with public record.

Such changes are not surprising as Lending Club is gearing up for IPO. It's focus has been shifting to non-lending financial institutions as lenders and attracting more borrowers to its platform becoming higher priority.

Can we confirm these changes using historical data from 2012?

Credit Grade Distribution of Monthly Loan Volume

The chart below shows the monthly loan volume in 2012 in relation to Credit Grade. The monthly volume lines for most months follow the same pattern except for December (Green line). There is a shift in the line for December from regular pattern for other months indicating there may have been a change in December how loans were allocated to different Credit Grade buckets.

Lending Club Monthly Loan Volume and Credit Grade in 2012
For most businesses, December tend to be a unique month due to holidays and end of calendar year. The chart below shows the monthly loan volume for 2011. The hypothesis being that if December is somehow unique month for share of loan volume across Credit Grade, it should show up in previous years too. As the chart shows, there is no deviation in line for December compared to the pattern for other months in 2011. This confirms that something changed in how credit grades are assigned for loans issued in December 2012.

Lending Club Monthly Loan Volume and Credit Grade in 2011

Monthly Loan Volume Change

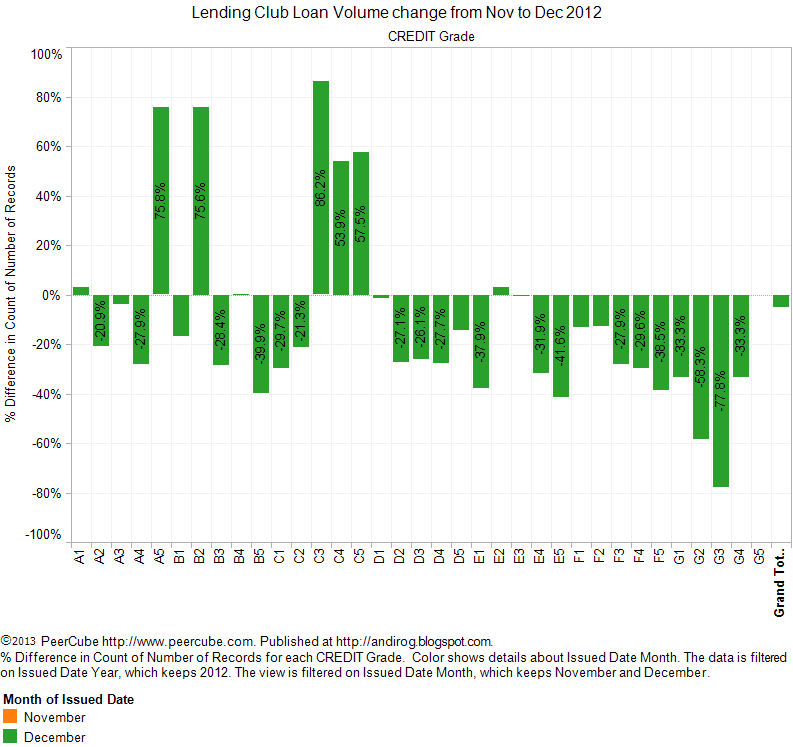
The chart below shows the percentage change in loan volume for each credit grade in December from previous month in 2012. The large spreads in percentage change for credit grades that normally has low loan volume is understandable. The interesting observation is that the percentage volume change for credit grade D through G is consistently negative in the month of December, indicating the loan volume for credit D through G was much smaller in December than previous month.

Lending Club Loans - Percentage Monthly Volume Change in December 2012
As a comparison, the chart below shows the percentage change in loan volume in November from previous month in 2012. The loans with credit grade D through G show large percentage increase in volume from previous month. Was the volume drop in December for loans with credit grade D through G due to increase in volume of same grade loans in previous month? At this point, it is difficult to separate the influence of policy changes from the up volume in previous month.

Percentage Monthly Loan Volume Change in Nov 2012
Another interesting observation is the large spreads in loan volume for loans with A through C credit grades in December. As shown in the chart for November, most volume changes for such loans will be typically low due to the high volume of loans. An usually large spread in volume will indicate influence of a policy change where shifting of loans taking place across credit grades from credit grade with decline in volume to credit grades with rise in volume.

Key Takeaways

  • The "proprietary scoring model" appears to have made some adjustments that is shifting the loans across credit grade, most probably toward B and C credit grades.
  • Without knowing the actual changes taking place in credit grade assessment of a loan, the credit grade will become an unreliable indicator of quality of loans. In my estimate, just considering Credit Grade as loan selection criteria was accounting for the quarter of the default risk.
  • With the credit grade becoming "proprietary" measure, most lenders may benefit by using Interest Rate bins (buckets) instead. Any analysis of historical data based on credit grade will become less valuable due to uncertain changes in credit grade over time.

PeerCube: Benefits of Loan Details on One Page

In my last blog post Lending Club 2012 in Review. Part III: Loan Title, Loan Description and State of Residence, I mentioned that I may take a short break to discuss a few development at PeerCube. In response, I received a suggestion to maintain the continuity of historical data analysis and discuss any PeerCube updates in a small separate section of the blog post. I thought the idea was excellent and time to time I plan to include PeerCube updates at the end of regular blog posts.

The loan details page on PeerCube includes 71 different loan and borrower attributes on one page. This collection of information enables users to  quickly scan loan details to identify any unusual attributes. With the recent changes in Lending Club policies, it is becoming much more important to review the loan details.

PeerCube Loan Details page: Borrower Details
The above screen capture of Loan Details page for a loan shows an example of discrepency that can be caught by reviewing this page. The Home Ownership is self-reported by the borrower. In this case, borrower reports Renting. Total Mortgage Accounts is reported by the borrower's credit report. In this case, credit report mentions borrower has three mortgage accounts.

Depending on your risk profile, you may decide to skip lending to this borrower due to financial uncertainty of the borrower. For example, this borrower may be a divorcee on hook for mortgage payments on a house occupied by ex-spouse, alimony, child support, etc. Such uncertainty about borrower's financial situation raises the risk profile of this loan significantly. Unless a lender was reviewing multiple spreadsheets made available by Lending Club or easy-to-scan one pager for the loan on PeerCube, he or she will misjudge the default risk with this loan.

Cash back rewards on online gift cards

Thursday, January 10, 2013

Lending Club 2012 in Review. Part III: Loan Title, Loan Description and State of Residence

Continuing the year-end review of Lending Club loans issued in 2012 from Part I and Part II where I discussed Loan Volume, Amount Funded, Interest Rate, Credit Grade and Loan Purpose ...

Loan Title

In 2012, the number of loans issued in relation to number of characters in Loan Title continue to follow similar pattern as previous years. Almost 25% of loans issued in 2012 had exactly 18 characters in loan title. Almost 50% of loans issued had less than 17 characters and 90% had less than 24 characters.

Length of Lending Club Loan Title, Loan Volume, and Total Amount Funded

The most popular 18 characters loan titles in 2012 are listed below. Considering 77% of all loans in 2012 were issued for debt consolidation and credit card refinancing purposes, it is not surprising to see related phrases dominating the loan titles.
  • Debt Consolidation
  • Credit Card Payoff
  • Consolidation Loan
  • 2012 Consolidation / Consolidation 2012
  • 2012 Personal Loan
  • Bill Consolidation
  • Card Consolidation

Loan Description

In 2012, 38% loans issued had no loan description. 50% loans issued had loan description with less than 90 characters. 90% of loans issued had loan description with less than 332 characters.

Length of Loan Description, Loan Volume, and Total Amount Funded
There was not much surprise with 53 character length of loan description, majority of them mentioned debt consolidation or similar variation and a few words. Similarly, 335 character length of loan description was primarily borrowers who wrote a complete sentence.

State of Residence

In 2012, borrowers from 45 different states took out loans on Lending Club platform. Only borrowers from state of Iowa (IA), Idaho (ID), Maine (ME), Mississippi (MS), Nebraska (NE), North Dakota (ND), and Tennessee (TN) were absent. Borrowers from Indiana (IN) joined in 2012. Iowa (IA) dropped off in 2011 and Mississippi (MS) dropped off in 2012.

The average amount per loan continue to rise for borrowers from all states with most increase from 2011 was for borrowers from state of New Mexico (NM), Vermont (VT), and Delaware (DE). The borrowers from Alaska (AK), Massachusetts (MA), and New Mexico (NM) borrowed the highest average amount per loan.

Borrower's State of Residence and Average Amount Funded
Borrower's State of Residence and Rise in Average Amount Funded
One change in 2012 from 2011 was that Texas bumped Florida to be in third place for the highest number of loans issued and total amount funded. California and New York continue to maintain first two spots. There were no significant changes in share of loans issued and amount funded to borrowers in each state in 2012 from 2011.

Borrower's State of Residence, Loan Volume, and Total Amount Funded

In future blog posts, I may take a short break from reviewing characteristics of Lending Club loans in 2012 to discuss a few developments at PeerCube.

Web Hosting - $6.95/mo!

Friday, January 04, 2013

Lending Club 2012 in Review. Part II: Interest Rate, Credit Grade, and Loan Purpose

Continuing the year-end review of Lending Club loans from my previous post where I discussed Loan Volume and Amount Funded ...

Interest Rate

In 2012, Lending Club increased the interest rates for most credit grade three times, in January, March, and July of 2012. By the end of 2012, the interest rate for loans ranged from 6.03% for credit grade A1 to 24.89% for credit grade G3, G4, and G5. I am happy to see Lending Club continuing to tweak interest rates and making loans more expensive for lowest quality borrowers. It will be great if in 2013 Lending Club can start issuing a summary of discussions from their Interest Rate pow-wow at least every quarter. I'm interested in knowing what made Lending Club to decide to change the rates.

2012 Interest Rate and Credit Grade for Lending Club Loans
As seen from the loan volume chart in my previous post, raising interest rates doesn't seem to have much impact on loan demand. But is the slowdown in loan volume growth in second half of the year due to interest rate hike in July? The average interest rate for loans has risen about 13% from 12.49% in January to 14.12% in December. The average interest rate (13.64%) in 2012 was the highest compared to previous five years; it has increased over 10% from the average interest rate in 2011. I'm afraid that higher average interest rate may lead to higher default rates.

Average Interest Rate for Lending Club Loans in 2012
Average Interest Rate, year over year for Lending Club Loans
The average interest rate for loans with 36 month term and 60 month term in 2012 was 12.63% and 18.08% respectively. The rise in average interest rate for both loan terms was similar from previous year.

Average Interest Rate for Lending Club Loans with 36 month and 60 month terms

Credit Grade

The Credit Grade and its relationship with Loan Volume, Total Amount Funded, and Interest Rate has already been discussed in previous post and earlier in this post. The lower quality loans with credit grade E, F, and G are continuing to be dominated by loans with 60 month terms in 2012. Since 2010 when Lending Club first issued 60 month term loans, 23.85% of all loans have been issued with 60 month term. Year 2013 will be a pivotal year in better understanding the defaults behavior of 60 month term loans as such loans are reaching mid-way point in their maturity cycle. This will also offer better insights into lower quality loans as such loans recently have been primarily 60 month term loans.

Credit Grade and Loan Term for Lending Club Loans, 2010 - 2012

Loan Purpose

In 2012, Lending Club borrowers reported loan purpose as debt consolidation and credit card refinancing 77% of the time. Year over year, the percentage of loans with reported loan purpose of debt consolidation and credit card refinancing continues to rise. 77.15% of total amount raised in 2012 was used to fund loans with reported loan purpose of debt consolidation and credit card refinancing. This is an increase of almost 25% over 2011.

At this growth rate, soon loan purpose attribute will become irrelevant as a selection criteria for loans. There is nothing stopping borrowers from claiming debt consolidation and credit card refinancing by running expenses for other loan purposes through credit card.

Loan Purpose Reported by Lending Club Borrowers, 2010 - 2012.
Loan Purpose and Amount Funded for Lending Club Loans, 2010 - 2012
While there has been significant growth in volume and total amount funded for loans with reported purpose of debt consolidation and credit card refinancing, the pattern for average loan amount has stayed the same for past three years. The highest average loan amount are for loans for small business, house purchase and debt consolidation purposes.

Lending Club Average Loan Amount and Loan Purpose, 2010 - 2012
The average interest rate for debt consolidation loans has risen to 14.11% in 2012 from 12.72% in 2011. The loans for car and major purchase purposes continue to carry lowest average interest rate for past three years.

Lending Club Loan Purpose and Average Interest Rate, 2010 - 2012
The table below shows the percentage of reported loan purposes within a specific credit grade. An interesting observation is that the debt consolidation loan purpose was more often reported for lower quality loans with grades E, F and G while the credit card refinancing loan purpose was more often reported for higher quality loans with grades A through D. Another interesting data is that the majority of loans for major purchases and car carry the high quality grade A rating while the majority of loans for home purchase carry the lowest quality grade G.

Loan Purpose and Credit Grade for Lending Club Loans in 2012
In my next post, I will continue reviewing the characteristics of Lending Club loans issued in 2012.

Send Large Files Up to 2GB - Free 14 Day Trial!

Wednesday, January 02, 2013

Lending Club 2012 in Review, Part I: Loan Volume and Amount Funded

Happy New Year to all my readers and to lenders on Lending Club platform. As Peter mentioned in his post In 2012 U.S. P2P Lenders Issue $871 Million in New Loans, Lending Club had terrific 2012.

Loan Volume

In 2012, Lending Club issued 53,367 loans, more than double the number of loans issued (21,721) in 2011. On monthly basis, in recent months the number of loans issued seem to be reaching plateau of little over 6,000 loans.

Lending Club 2012 Monthly Loan Volume
In 2012, over 90% of loans issued were of higher quality with credit grade of A, B, C, and D. Only 8.92% of loans (4,761 loans) were issued with credit grade E, F and G. In comparison, Lending Club issued 12.26% of loans with credit grade E, F, and G in 2011. Lending Club continues to show commitment toward improving listing of higher quality loans on its platform.

Lending Club Loan Volume by Credit Grade 2010 - 2012
As Lending Club announced in its blog post Investor Updates and Enhancements, beginning October 2012, LC started to reserve some loans for institutional and other investors who wanted to fully fund loans themselves. Since then percentage of loans offered initially as Whole on monthly basis is continuing to increase. In October 2012, only 13.51% of loans were initially offered as Whole and that ratio more than doubled to 29.10% by December. Overall in Quarter 4, 20.85% of loans were initially offered as Whole.

I will recommend lenders, who would like to filter loans using initial list status as criteria, to consider using PeerCube filters. PeerCube now enables users to filter loans using 41 different loan and borrower attributes including Initial List Status.

Lending Club 2012 Loan Volume by Initial List Status
As I expressed concerns in my blog post Lending Club Loan Length and Default Rate about excessive 60 month term loans in 2011, it appears that the share of 60 month term loans in 2012 dropped to 18.55% of total loans issued, almost half of the 35.08% share in 2011.

Lending Club Loan Volume by Loan Term, 2010 - 2012

Loan Amount

Lending Club lenders funded $718 million in loans issued in 2012. This amount is over two-and-a-half times more than $257 million funded in 2011. As mentioned earlier, while the number of loans issued in last four months of 2012 stagnated, the amount funded continued to rise in the same period.

Lending Club 2012 Loan Amount Funded
The stagnant number of loans but higher loan amount funded in last quarter of 2012 indicates that most likely the amount funded per loan was much higher than loans issued prior to last quarter. In fact, on average $14,100 was lent per loan in last quarter, almost 10% increase from previous quarter. This also reverses the declining trend in average amount funded per loan for past three quarters.

Lending Club 2012 Average Amount Funded per Loan
While only 8.92% of loans with credit grade E, F, and G were issued in 2012, such loans received 15.29% of the funding. The funding for such loans was slightly lower compared to 18.74% in 2011.

Lending Club Total Amount Funded by Credit Grade, 2010 - 2012
The small reduction in funding for lower quality E, F, and G grade loans doesn't match the significant reduction in number of such loans issued in 2012. The average amount per loan increased across all credit grades but the increase in average amount was much higher for loans with credit grade E, F, and G.

Lending Club Average Amount per Loan by Credit Grade, 2010 - 2012
Going forward, I am particularly interested in monitoring Initial Listing Status and how it impacts retail lenders like myself. I was surprised to see that the percentage of total amount funded for Whole loans is almost same as the percentage of loans initially listed as Whole loans. With such a short duration since initial listing status went into effect, it is difficult to make any significant observations.

Lending Club Total Amount Funded by Initial Listing Status

Lending Club Average Loan Amount by Initial Listing Status
Similar to decrease in number of loans with 60 month term, the percentage of total amount funded in 60 month term loans also decreased from 48.50% in 2011 to 29.39% in 2012. Still, over $200 million were contributed toward 60 month term loans in 2012, almost 70% increase from 2011.

Lending Club Total Amount Funded by Loan Length
The average amount funded per loan significantly increased (by almost 30%) for 60 month term loans from $16,382 in 2011 to $21,246 in 2012. Similar increase (by almost 25%) is observed for 36 month term loans.

Lending Club Average Loan Amount by Loan Length
Lending Club had spectacular year 2012 as observed by total amount funded. There is significant increase in larger loans issued last year. I expect the growth in 2013 to be driven by loans of larger amounts rather than increase in number of loans listed on LC platform.